Here results for a specific NHS hospital (Trust) can be compared to the national average and to other hospitals. Below you can select the hospital and the period you would like to see results for (either the most recent 12 months data are available for or the 12 months prior to that). If a result for your hospital is missing, this is because it did not pass our data quality checks.
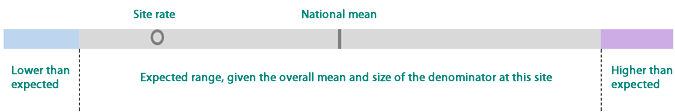
The percentages of each measure are presented with the numerator (the number of patients who had the indicator) and the denominator (the number who could have had it). The national average (mean), highest, and lowest percentages are also presented for reference. Each result is also shown on a spine chart. This shows the result for the hospital compared to the national average and the expected range of results around that average. A percentage outside the expected range means there is statistical evidence (p<0.05) that the hospital's result is different to the national average. This could be due to different clinical practices or differences in the patient case mix. Further information for interpreting the results can be found on the FAQ page.
We provide information on care practices to help interpretation of the maternity outcomes reported. For example, the percentage of third or fourth degree tears (an outcome) will be influenced by a hospital’s selection of patients for interventions such as assisted delivery (a care practice). However, it is important to note that there are no ‘correct’ values for care practices to take: a higher or lower than expected result does not indicate a hospital is better or worse than average.
Please note that caesarean section rates are not being reported at this time.
Airedale NHS Foundation Trust
August 2021 - July 2022